Tasks
Spreadsheets
Ask for a budget, tracker or model and you get a live grid with real formulas, one the assistant can also sort, format, chart and read back from.
Anything numeric, a budget, a roster, a tracker, a model, a comparison table, comes back as a sheet: a live grid with working formulas, not a table pasted into a message. Change an input and the totals recalculate, the same as any spreadsheet.
Where it runs: in a task.
What the assistant can do
| It can | What that looks like |
|---|---|
| Create a sheet | A new grid beside the task, headers in the first row, totals as real formulas |
| Write a block of cells | Append rows, fill a column, replace a table |
| Write scattered cells | Fix one number, add a total, clear a cell |
| Read a range | Pull the actual computed numbers before summarising or comparing them |
| Format a range | Bold headers, alignment, currency, percentages, decimals, text and fill colour |
| Change the shape | Insert or delete rows and columns, sort, freeze headers, merge cells, add or rename tabs |
| Add a chart | A live chart beside the grid, drawn from a range |
| Add a rule | Conditional formatting, red below a threshold, green when a status is “Done” |
| Rename it | Title only, data untouched |
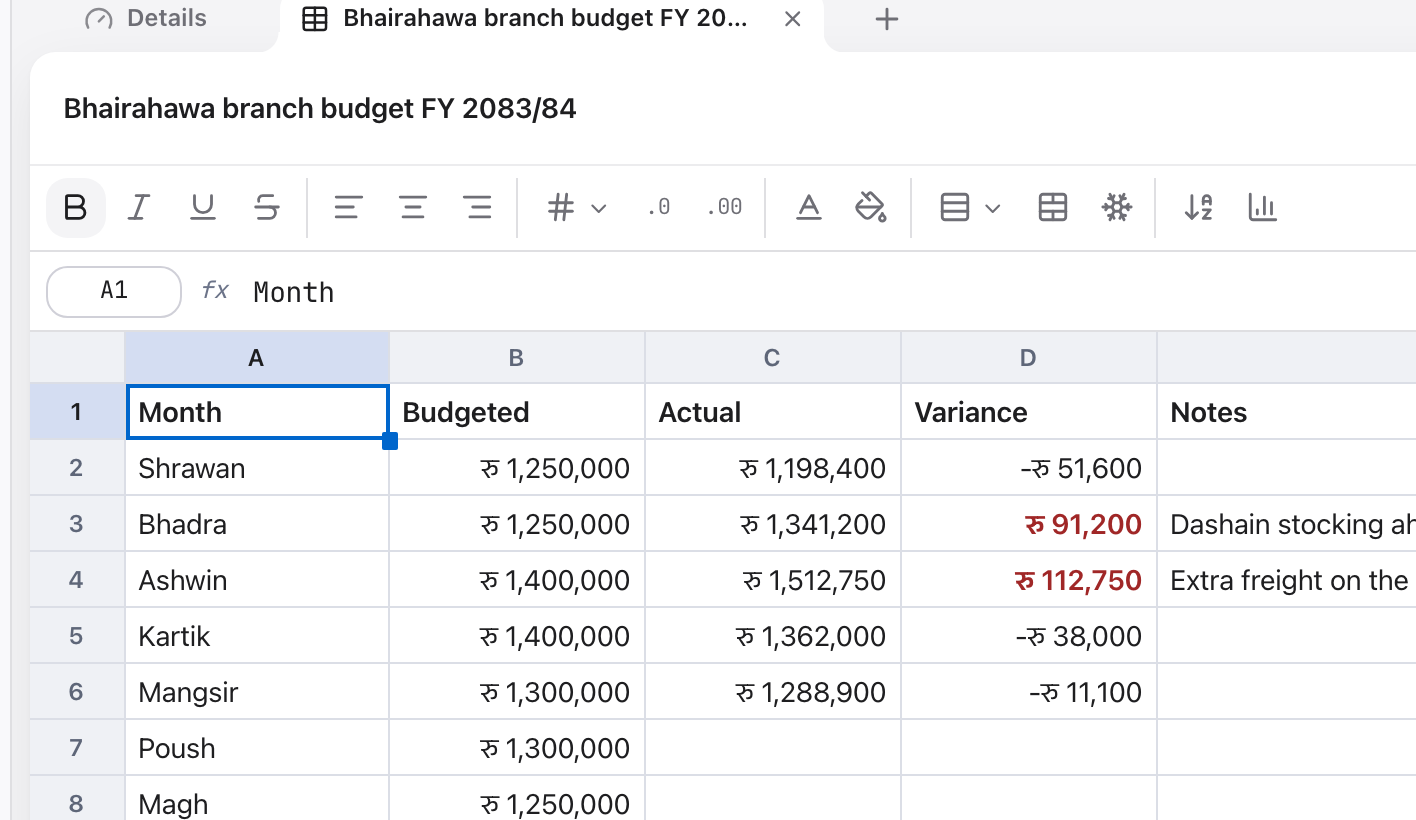
The grid, its toolbar and the formula bar, the same sheet the assistant is writing into.
Formulas are real
The assistant is told to write =SUM(B2:B13) rather than a pre-computed number,
so the sheet stays useful after you edit it. Values you see are calculated on the
fly, they are not stored, which is why the numbers are always consistent with
the formulas, whoever typed them.
When it moves rows or columns, formulas that pointed at them are rewritten
automatically. If a formula’s target genuinely disappears you get #REF!, the
same as anywhere else.
Dates in a sheet
Dates follow your own settings, Bikram Sambat or Gregorian, your zone, your week start. Two people looking at the same sheet see the same day rendered in their own calendar, so a Kathmandu colleague and one abroad are never arguing about which day a row refers to.
Getting it out
A sheet exports to XLSX or CSV. Formulas, formatting and charts survive the XLSX round trip; CSV is values only, one tab at a time.
Working with it well
Give it the shape you want. “Columns: month, budget, actual, variance” beats “make me a budget”.
Ask it to read before it reasons. For a large sheet, say “check the actual numbers first”, it will read the range rather than working from the preview.
Ask for the chart. Charts are not automatic. “Plot actual against budget by month” adds one.